Yet another E-Ink weather display - but with Rust!
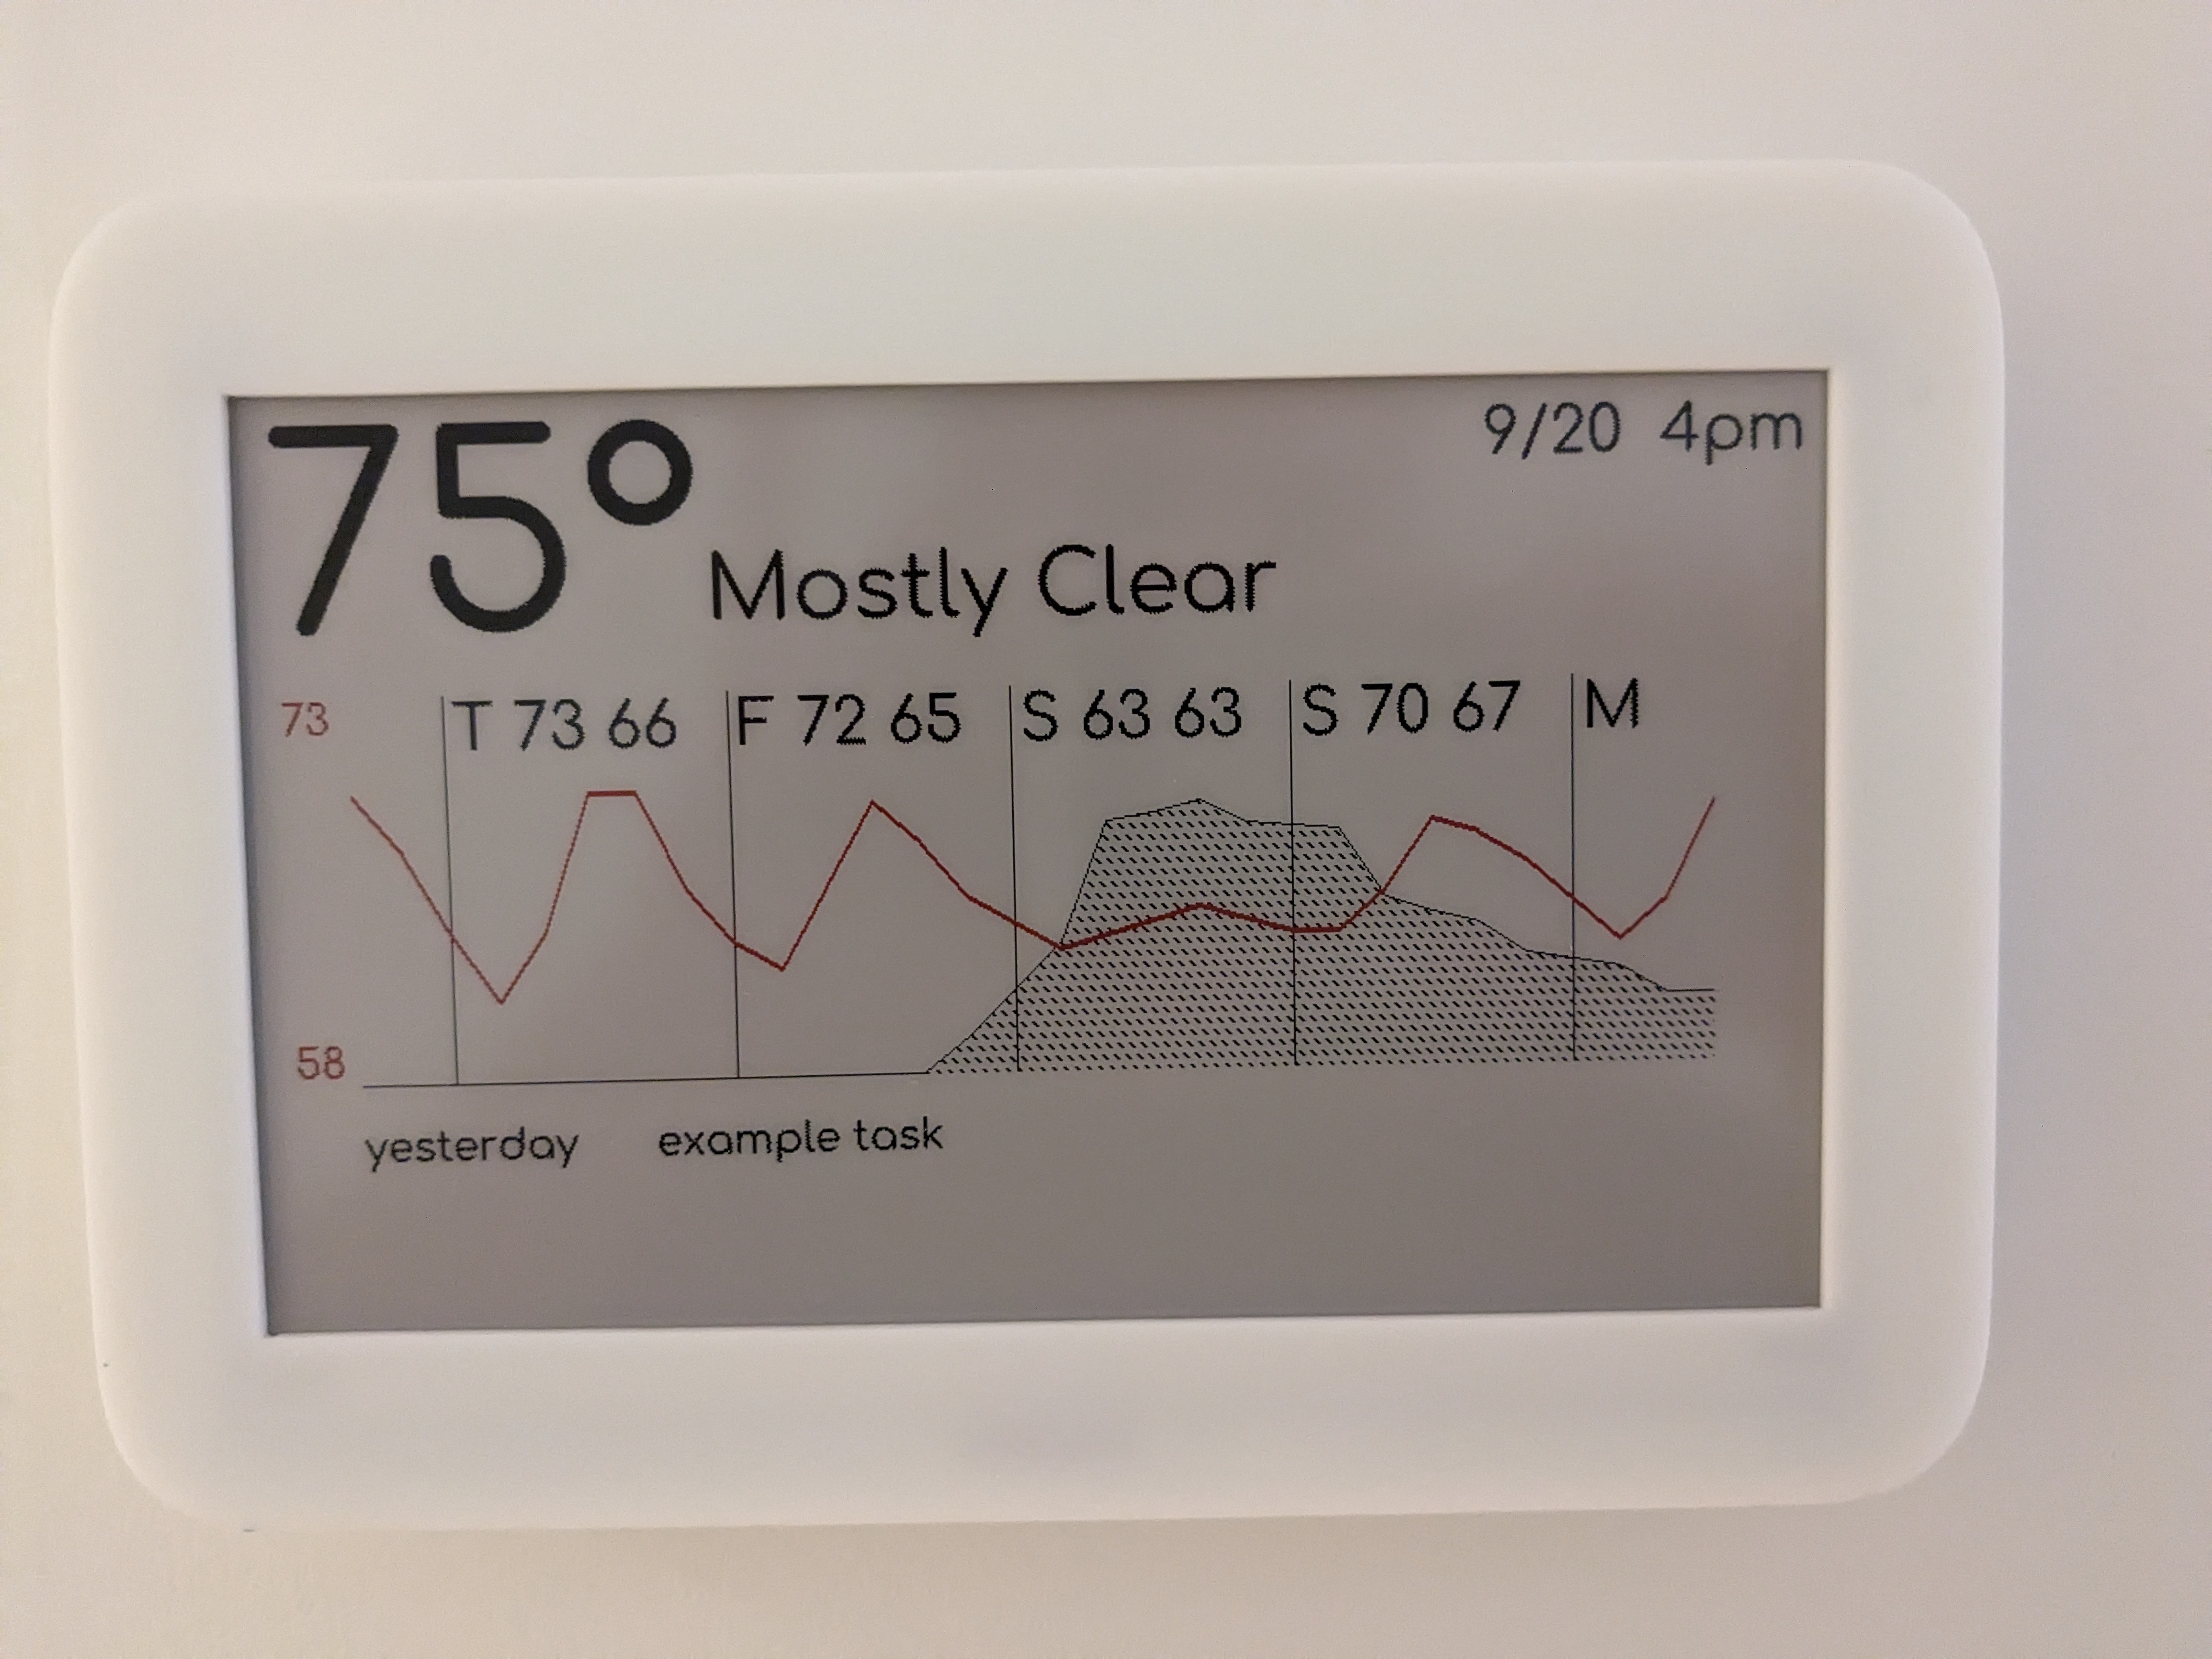
I made one of those e-ink weather displays that you see on tech blogs and hacker news sometimes. It can display the current weather, the temperature and precipitation forecast for the rest of the week, and my current and upcoming tasks from Todoist. It's powered by a couple NiMH AA batteries and lasts at least a couple months on a single charge, if not more.
The code can be found on my github.
Hardware
E-ink display
The screen is a 7.5", 800 by 480 pixel, 3-color e-ink display that I purchased from waveshare. It does black, white, and red, which is slightly unusual for e-ink and increases the price and lowers the refresh rate, but looks really nice. I believe it works (skipping over how e-ink works in general) by first pushing the black particles to the front, and then pushing the red particles, which are maybe smaller or lighter or less dense, further in front of the black ones.
Microcontroller
I bought a pre-assembled ESP32 board, also from waveshare, which contains the FPC connector already assembled and connected to the ESP32 module's SPI pins.
I desoldered the on-board LEDs to increase battery life, since the power LED was always on, and the other led seemed to be slightly receiving/drawing power during sleep. I was able to turn it off in software by configuring an internal pulldown to stay on during sleep but I wasn't sure if that would also draw some current so I just removed it since I wasn't using it.
Software
This project consists of two different Rust projects.
There's the code that runs on the esp32 board connected to the display, and then there's also code running on a server that both gathers the data and renders it to a file. Originally I was going to do everything on-device, but since the display is battery-powered I thought it would be more efficient to download a single file and display it. So all the API requests, graph drawing, and text rendering operations happen on the server, and the display board effectively acts as a dumb terminal which just displays the data it receives.
On-device software
ESP32 overview
For the "firmware" running on the esp32 board, I'm using esp-idf with the standard library (i.e. not no-std) via the esp-rs project.
Setup is a tiny bit complicated, but the esp-rs book is a great guide and explains everything fairly clearly. Hopefully one day it will be as simple as "edit your runner in .cargo/config.toml to use espflash and then just cargo run" although I think for RISC-V boards with no-std it might be pretty close already. I added a Justfile that exports the libclang and esp toolchain environment variables internally so that I can just build and just run.
The esp32-std embedded ecosystem is comprised of several different crates, including:
- esp-idf-sys, which contains bindgen bindings to the esp-idf C API
- esp-idf-hal, which contains higher-level, type-safe wrappers and drivers for hardware like GPIO and SPI
- esp-idf-svc, which contains implementations and wrappers for system services like Wifi and storage
Additionally, the above crates use and implement traits from the following embedded-rust ecosystem crates:
and several other setup utility binaries like espup, espflash, and embuild, in addition to a fork of the rust compiler for the Xtensa/ESP32 architecture (there are also RISC-V ESP32 processors which don't require the forked compiler and llvm).
I mostly read example code, the various projects' mentioned above documentation, and the esp-idf documentation to figure out how to put everything together. In particular this repo is fairly extensive: https://github.com/ivmarkov/rust-esp32-std-demo
It can be somewhat confusing to figure out which types you need from which crates to e.g. turn on wifi, but this isn't unique to esp32 or embedded rust. Libraries will take traits from embedded-hal/svc as impl parameters and it can sometimes be difficult to figure out how to instantiate concrete versions of those types. Typically the sample code is useful in those cases to get things started.
Overall, the code is pretty simple.
- We "gather" the peripherals we need - spi, the modem for wifi, and the gpio pin used to wake up via button press
- Turn on the wifi
- Get the display data from the server
- Turn off the wifi
- Send the data to the display and wait until we expect it's done
- Tell the e-ink display to go to sleep
- Tell the device to sleep for 90 minutes or until the button is pressed
The URL to request the data from and the wifi SSID and password are just constants in a src/config.rs file which isn't checked in to git. This gets baked into the final binary.
Getting the data
To request the display data from the server, we use the esp_idf_svc::http and embedded_svc::http modules.
There really isn't too much to the code - it's a pretty standard http request. The only thing of note is that we explicitly check that we're getting the right size file back from the server to fit the display.
Waveshare e-ink driver
To send the image data to the display, we use the epd-waveshare crate, but because the last release was published to crates.io 2 years ago, we have to use the git repo url directly in our Cargo.toml file. My display uses the "epd7in5b_v2" driver. The sticker on the back says v3 but everything seems to work.
Other than that everything just works - you set up the SPI device, pass it to the library and give it the image data. It doesn't seem to wait for the display to actually finish updating, so we wait for about 20 seconds before sending a sleep signal to the display, which lowers its power consumption. Since it's an e-ink display, the image continues to be displayed even during sleep, of course.
Aside: The memory layout for the display data is just the raw bits bitpacked into bytes. The red pixels are handled by simply having two separate buffers packed next to each other. This is inefficient in terms of space - we could instead do a variable length encoding scheme where say 0 is white, 10 is black and 11 is red. However, this would make it significantly slower to do standard drawing operations because individual pixel access becomes O(n).
Rendering software
The rendering code was by far the most interesting. Everything is drawn with the imageproc crate, which uses the image crate and the rusttype crate for fonts. Additionally, it uses the same epd_waveshare crate and also the embedded_graphics crate to pack the image buffer into the format used by the display driver.
So again, the strategy here is to draw the image into a generic image buffer, and then "render" it into the driver display library's buffer type as if the code were running directly on the device. Then as above the esp32 downloads the file and sends it directly to the display without having to do any extra work.
Gathering the data
I'm using weather.gov's free API for the weather data, which requires just a couple HTTP requests to get the current weather and the forecast. To figure out the station and gridpoint parameters for the requests, you'll need to make a couple requests manually to some other endpoints that take GPS coordinates and return the nearest stations and gridpoint.
The todo list data is just a single API request with a filter of -24h to +48h on the due date.
Drawing and measuring text
While imageproc has a built-in function for drawing text, I had to write several variations of wrappers to get different alignments. The measure_text function I'm pretty sure was taken from example code somewhere in rusttype or imageproc.
Drawing the graphs
Imageproc's line drawing methods are just basic Bresenham and have no thickness parameter, so to get thick lines I just drew them with the start and end points offset vertically by a pixel. Note that this obviously does not work for perfectly straight lines and mathematically you'd want to offset by the vector perpendicular to the original line, but since the graph is mostly horizontal it works fine for this case.
Regarding the precipitation graph, it was a fair amount of trial and error to get it looking the way I imagined it. The code is a little obscure and I'm pretty sure it can be simplified. The idea is that we just split the graph into 6x6 squares, turn on some pixels on the diagonal, and then offset the squares themselves. The last part is the part that I think could be simplified (or at least better explained) and is expressed in the xm variable in the code.
I really love how the thin lines in the precipitation graph really make it look blue even though it's the same black as the rest of the image.
Dithering and "rendering" to the display buffer
Since the display can only handle 3 colors but the text is rendered with anti-aliasing (and I couldn't find an easy way to not anti-alias)(EDIT: I did end up finding a way to not anti-alias by rendering the fonts myself, basically, so this section is not correct anymore. See the code here) I ended up using the image crate's dithering functionality with just a manually-tuned cutoff point that looked good with the font and the display. Fortunately e-ink displays are a bit fuzzy due to their construction, so combined with the curvy font I chose it's hard to see any artifacts without looking very closely.
After the final image is dithered to white/black/red, we use the same exact crate that's used in the firmware, but this time to write the buffer instead of read it. All we have to do is enumerate over the pixels in the image and call set_pixel inside the buffer, and the crate takes care of doing the bitpacking for us. It could be done more efficiently, but since we're not running on the device it doesn't matter as much.
Running the rendering software
Unlike the firmware, the rendering software takes an actual json-formatted config file as a cli parameter, along with the location of the output file.
The rendering binary gets run every hour via a systemd user service and timer file which can be found in the scripts/ directory. In my case, the output file gets put into a directory which nginx is configured to serve static files from.
Extrasafe
I used my own extrasafe crate in the rendering software on the server. It allows you to restrict your software's syscall usage to a subset of your choosing via seccomp. We start one thread to make the HTTP requests to all the APIs, then pass that raw JSON data to another thread with even less privileges to do the parsing, and finally pass that back to the main thread, where we then do our final restriction that only allows us to write to the output file. I think ideally we would first spawn the threads, wait until the original thread is restricted, and then run the other threads, but with more than one worker thread in the sequence it becomes difficult to organize everything manually.
I'm currently working on improvements to extrasafe to allow the use of Landlock and also maybe a helper function for the unshare syscall. In particular I'd like to restrict the network thread's filesystem access to only the necessary files for DNS and SSL, rather than all files.
The Case
I learned how to use CAD software for this project and it was simpler than I thought it would be.
First, you select a plane to draw on, which can be either a plane along two major axes, or a plane formed by part of your model that you've drawn alreday. Then you can draw 2D shapes on that plane with standard 2D curve tools like lines, bezier curves, conics, etc. Once you've got the parts of your shape in place, you then need to constrain the shape. Here "constrain" means to lock in the position, dimension, and other parameters such as angles, radii, control point position, which you do with operations like "these two points are concurrent", "these two points are symmetric about this line", "these two lines are perpendicular", "the length of this line is 5mm", "the angle between these two lines is 30 degrees". Finally, back in "3D mode", you can use tools to extrude, cut out pockets, revolve, or otherwise 3d-ify the 2d sketches you drew.
Additionally, you can make a spreadsheet or mapping of labeled dimensions and use them in the 2d sketches or extrusions in place of using specific dimensions like "5mm" and the model will automatically be updated when you change the values. Overall it's actually pretty fun, although maybe a bit tedious.
I tried out both freecad and onshape, and freecad seemed a bit too easy to get into a buggy state but I otherwise liked the constraint interface. In particular one tiny thing I liked about freecad was that the sketch turned a very visible green when it's fully constrained. Onshape's blue/black scheme is pretty low contrast and can be hard to see, especially when using flux or redshift. Maybe I just missed an external indicator that said whether the sketch was fully constrained or not. The built-in variables table in onshape was simpler than freecad, where you have to use spreadsheet workbench or a separate plugin, and even then I'm pretty sure you have to type spreadsheet.<name> or dd.dd<name> whenever you want to use a variable inside a sketch. I also didn't see a way in onshape to see a list of constraints like you can see in freecad.
I had the case printed by JLCPCB in white resin via SLA for about $20 - $30 USD shipped and it was both really easy and it came out pretty clean. I had to do a second revision because I messed up with the bezel size (accidentally made it symmetric rather than the bottom having a larger lip) and the second order came out just as good or better than the first. Here's the oncad project.
I couldn't find any cheap 3D printing services in the US to do the print for me - I guess they either get outcompeted on labor costs by China or there isn't demand for them on a hobbyist level because hobbyists can buy their own or use a makerspace's printer?
The case is mounted on the wall with regular Command picture hanging strips - I designed pads on the backside of the case specifically for this purpose.
Things I would like to improve
- Case snap-fit for pcb, maybe for display as well/or just supports
- I'm not really sure what's possible for resin in terms of both printability and flexibility / thin parts
- Custom PCB with a lower quiescient current voltage regulator for improved battery life? Plus on-board battery holder.
- The weather.gov API is occasionally flakey or provides bad JSON, maybe add a retry option via the systemd unit file
- Add some code to note if the image from the server hasn't been updated (either via comparing to an RTC or storing the last successful update time in flash) and then maybe draw a red dot or line in the top corner or somewhere. This would be equivalent to just setting one or a couple bytes to all 1s in the binary, so it wouldn't be very difficult.
- Minor issues with graph data
- Make daily high/lows red and smaller
- Show daily high/lows for current day
- Measure current draw accurately
- Current ranger / ucurrent gold / borrow one from somewhere?
- Better test the renderer
- Set up some kind of testing with qemu for the firmware
Conclusions
It's really easy and fun to get started writing code for microcontrollers in Rust! CAD is also pretty fun.
Thanks to Neil Chen and Stan Zhang for reviewing a draft of this post
Update 2023-10-13: Thanks to Hacker News commentors doodlebugging and goosinmouse for pointing out some issues with the temperature scale and min/max values that I believe I've fixed.